Guide to Rivercast for iOS & Android
Thank you for using Rivercast™. This guide helps you get the most out of Rivercast's features.
- Using the Map
- Using Search
- Using Favorites
- Using the Hydrograph
- Using Notification Alerts
- Using the Widgets
- Using the Apple Watch app
- About Us
Data courtesy of NOAA's National Weather Service and National Water Prediction Service (NWPS). Most data is automated and not manually quality-controlled. Use discretion if relying exclusively on this information, and contact your local NWS River Forecast Center if you have questions or concerns.
Observations may sometimes be a few hours late due to small delays as NOAA processes its data. Map data, Search, Favorites and gauge graphs can be refreshed by tapping the refresh button in the upper right corner. Not all stations have forecasts and/or observations available at all times.
Please note that some hydrographic data that you may be able to find elsewhere is not available in this app. Some US Government data sources have not been converted to a format where Rivercast can include them for "Instant Observations" or provide interactive graphs.
Using the Map
From the map tab you can see where gauge stations are (reportedly) located, and tell a little about them just by the color of the map symbol used. You can get a recent gauge reading of the waterway by tapping the map symbol, and then a detailed hydrograph by tapping the reading "bubble".
Rivercast will attempt to refresh map and favorites data if there is no cached data or the data may be "stale" whenever the app is opened. You may refresh the data manually at any time by tapping the Refresh icon in the upper right.
You can go to your current location by tapping the "current location" icon in the upper right corner.
The stations mapped are those which NOAA is currently making available in a format that Rivercast can use, with over 12,000 at last count. There may be gauges on some waterways which are not included as they have not been fully integrated into NOAA's systems. Stations are often added or dropped as funding and priorities change, or gauges become inoperable.
The map station symbols are color coded to their recently observed conditions. Please note that not all gauges have all conditions defined by NOAA. In fact, some waterways will be defined as "Normal" no matter how high their gauge reads, while others may have "Action" stages but no flood stages, and so on.
You may change the map style between Normal, Hybrid, Satellite and Terrain via Settings.
Map Symbols
A "star" symbol indicates the station has been added to your Favorites, and a "square" symbol indicates it has not.

 Major Flood Stage
Moderate Flood Stage
Flood Stage
Major Flood Stage
Moderate Flood Stage
Flood Stage
 Action Stage Near Flood Stage
 Normal Conditions
 No Stages Defined No pre-set stages are in use for the gauge location
 Low Water
 Old Data Instant Observations may not be available, but often you can still generate a hydrograph. The
data
may be old or incomplete.
Unknown Instant Observations are not available, but often you can still generate a hydrograph. Gauge may
be
seasonal.
Gauge Out-Of-Service
Old Data Instant Observations may not be available, but often you can still generate a hydrograph. The
data
may be old or incomplete.
Unknown Instant Observations are not available, but often you can still generate a hydrograph. Gauge may
be
seasonal.
Gauge Out-Of-ServiceYou can access the map legend any time by tapping "Legend" in the lower right of the map. Users who have purchased the Premium upgrade have the ability to filter the map by river stages.
Using Search
If you would prefer to not use the map to find stations, you can use the search function. Searches are not case sensitive. You may search by
- Waterway name. Mississippi, Columbia, etc.
- Official 5-character NOAA station id. VAPW1, BLVI4, etc.
- 2 Letter State Abbreviation. WA, VA, etc.
Using Favorites
Gauge stations added to your favorites list will allow you to review recent observations for them at a glance. You may also get a detailed hydrograph for any station by tapping the "details" button on the right.
You can add stations to your favorites from the station's hydrograph page by tapping the "Star" icon on the bottom toolbar.
Premium users can have unlimited stations in their favorites. Other users are limited to 1.
Using the Hydrographs
From the Map or the Favorites tabs, you can get a detailed hydrograph on the recent history and forecast for the station.
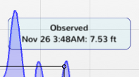
To get fine-tuned graph readings, you can "touch and hold" on the graph with your finger then slide your finger along the graph for a detailed reading via the "bubble label" for a given time.
You can also pan left, right, up, and down with your finger, or even zoom in and out with pinch gestures.
If you prefer to see graph data in cubic feet per second (cfs), you can set your app preference via settings. If you just want to switch between CFS and Feet on a given graph, tap "Feet" or "CFS" in the toolbar. Some stations may show kcfs instead, where 1 kcfs = 1000 cfs.
Upon presentation the graph will show approximately the last 30 hours of history and the next 30 hours of forecast. Please note that history and forecast durations vary by station. Not all stations provide forecasts. Premium users will be able to pan beyond the 30 hour limits if the data is available.
Sharing your graph
To share your graph with others via EMail, Message, Facebook, Twitter, etc., or to save it for off-line viewing, tap the "Action" tool bar button, and select the appropriate action.
Station Info
To view a location's various applicable stages (ie Flood, Major Flood, Record), flood impacts, location pictures, or other gauge details, tap the "Info" icon in the graph toolbar.
Flow (CFS) vs Height (ft)
There are two ways of measuring river water. You can measure river height (in feet) above a particular datum point. This may be sea level or some other datum. Alternatively, you can measure water flow in Cubic Feet per Second (cfs, or kcfs where 1kcfs=1000cfs). This measures the estimated volume of water flowing past a particular location in a waterway. CFS is a calculated, estimated value derived from stage height, so you may see slight differences when comparing NOAA and USGS data for the same gauge. Both NOAA and USGS periodically review and update their flow data formulas, but not necessarily at the same time.
With Rivercast you can set your measurement preference in "Settings", or you may alternatively tap the CFS or Feet button for just a single graph. Rivercast will attempt to present the data the way you request, but if your preferred measurement data type is not available (or the data appears suspect), Rivercast will use the other. Flow and Height data is not available on all stations for Instant Observations.
Custom Graph River Levels
You can also add Custom Levels to any favorited graph by tapping the "Levels" icon in the Toolbar. (Please note that these are different than setting Notification Alerts which will push river level notifications to your device.) Common uses for custom levels include marking levels for sandbars, exposed rocks, safe bridge clearance, safe wading levels, etc. on your graph. You can even select the line color and add a custom description. Any custom levels you add are specific to the unit type of the graph, which means any levels in feet will not appear in the graph if you are displaying cfs, and vice versa.
By tapping the Map icon in the toolbar, you will be returned to the map with the current station selected.
Weather Alerts
While a hydrograph page is loading, Rivercast also retrieves official National Weather Service alerts based on the selected river gauge's location - usually the county. If any alerts are found, a banner will appear across the top of the hydrograph screen (you won't miss it) describing the alert type (i.e. "Flood Warning", "Flood Watch", etc.). If there is more than one alert for an event type, Rivercast will combine them for you. To get a detailed description of an alert, just tap the banner! Please note that since alerts are often issued county-wide, just because there is a flood alert showing for your river location, doesn't mean it is actually the river flooding - please read the alert to determine if it is pertinent to you.
Using the Widgets
Rivercast includes widgets for iOS and Android. Rivercast's widgets can show up to your first eight favorite locations (don't forget you can change the order of your favorites in Rivercast's Favorites screen). The widgets are not color coded like the Rivercast Favorites screen, but will show a ⚠ symbol next to any locations which are at or above designated flood or action stages. You can go straight to the hydrograph in Rivercast by simply tapping the reading.
Using the Apple Watch App
Rivercast includes a companion Apple Watch app for iOS users. This is a Premium feature. The watch app can display up to the first 8 of your favorites. It also includes multiple widgets/complications. Tapping a favorite on the watch will attempt to open its graph on your iPhone.
Using River Level Notification Alerts
Do not rely solely on Rivercast alerts or data if life or property may be endangered!
From the hydrograph page, you can add Alerts to send you Push notifications for most locations. Alerts for some locations are not yet available, they may be added later.
You can create an alert notification from the graph screen by tapping the "alarm" icon on the bottom of the screen. You may set up more than 1 alert per location, however to keep our server loads manageable each device is currently limited to 16 alerts total.
If alert conditions are triggered, the Rivercast server will send you a push notification. You will receive no more than 1 notification for each alert per 24 hours. Rivercast will check for triggered conditions approximately twice an hour.
Please verify that "Notifications" for Rivercast are enabled via your device's settings, or otherwise you will not receive them. You can send yourself a Test notification via Rivercast->Settings->Advanced to verify you have everything configured properly.
If you need assistance with using or changing your device's Notification settings, for iOS users Apple has an excellent guide at https://support.apple.com/en-us/HT201925, and for Android users Google has a guide at https://support.google.com/android/answer/9079661.
Premium Upgrade is required to use Rivercast notification alerts.
About Us
Juggernaut Technology is a small, independent software company with over 20 years of experience. We are privately owned and self-funded, with no private equity or venture capital backing, allowing us to focus on long-term quality, reliability, and direct relationships with our users.
For more information about this app or other projects, please visit us at www.RivercastApp.com.
We would appreciate your feedback! Please email us at info@RivercastApp.com if you have any complaints, suggestions, or comments.
Copyright 2012 -
Juggernaut Technology, Inc. All Rights Reserved.
Rivercast is a trademark of Juggernaut Technology, Inc.
Would you like to know current and recent ocean conditions? Try NOAA Buoy Reports, our app that not only tells you current ocean buoy conditions, but past history up to 45 days!
Are you wiring new systems or rewiring old on your boat, RV, or car? Try WireSizer, our ABYC conforming wire gauge and voltage drop calculator!
Do you ever find yourself walking down a dock, scratching your head wondering, "Who made that boat?" Try HINSearchPlus, our Hull Identification Number lookup and more App!